

Bhumi Mehta
Tableau Developer
The different graphs depicted with the help this data are:-
1. Total crime in each state
2. Total percent of crime in each state
3. Total percentage of different crimes in India
4. Word map of different crimes
5. Average cimerate of different crimes in year 2001-2003
6. Average cimerate of different crimes in year 2004-2006
7. Average cimerate of different crimes in year 2007-2009
8. Average cimerate of different crimes in year 2010-2012
9. Yearwise trend of crimerate in India

The graph above picturize the overall crime committed against children all over India in the years from 2001 to 2012. The darker the colour the higher percent of crime imposed on children and lighter the colour less the percent of crime against children.
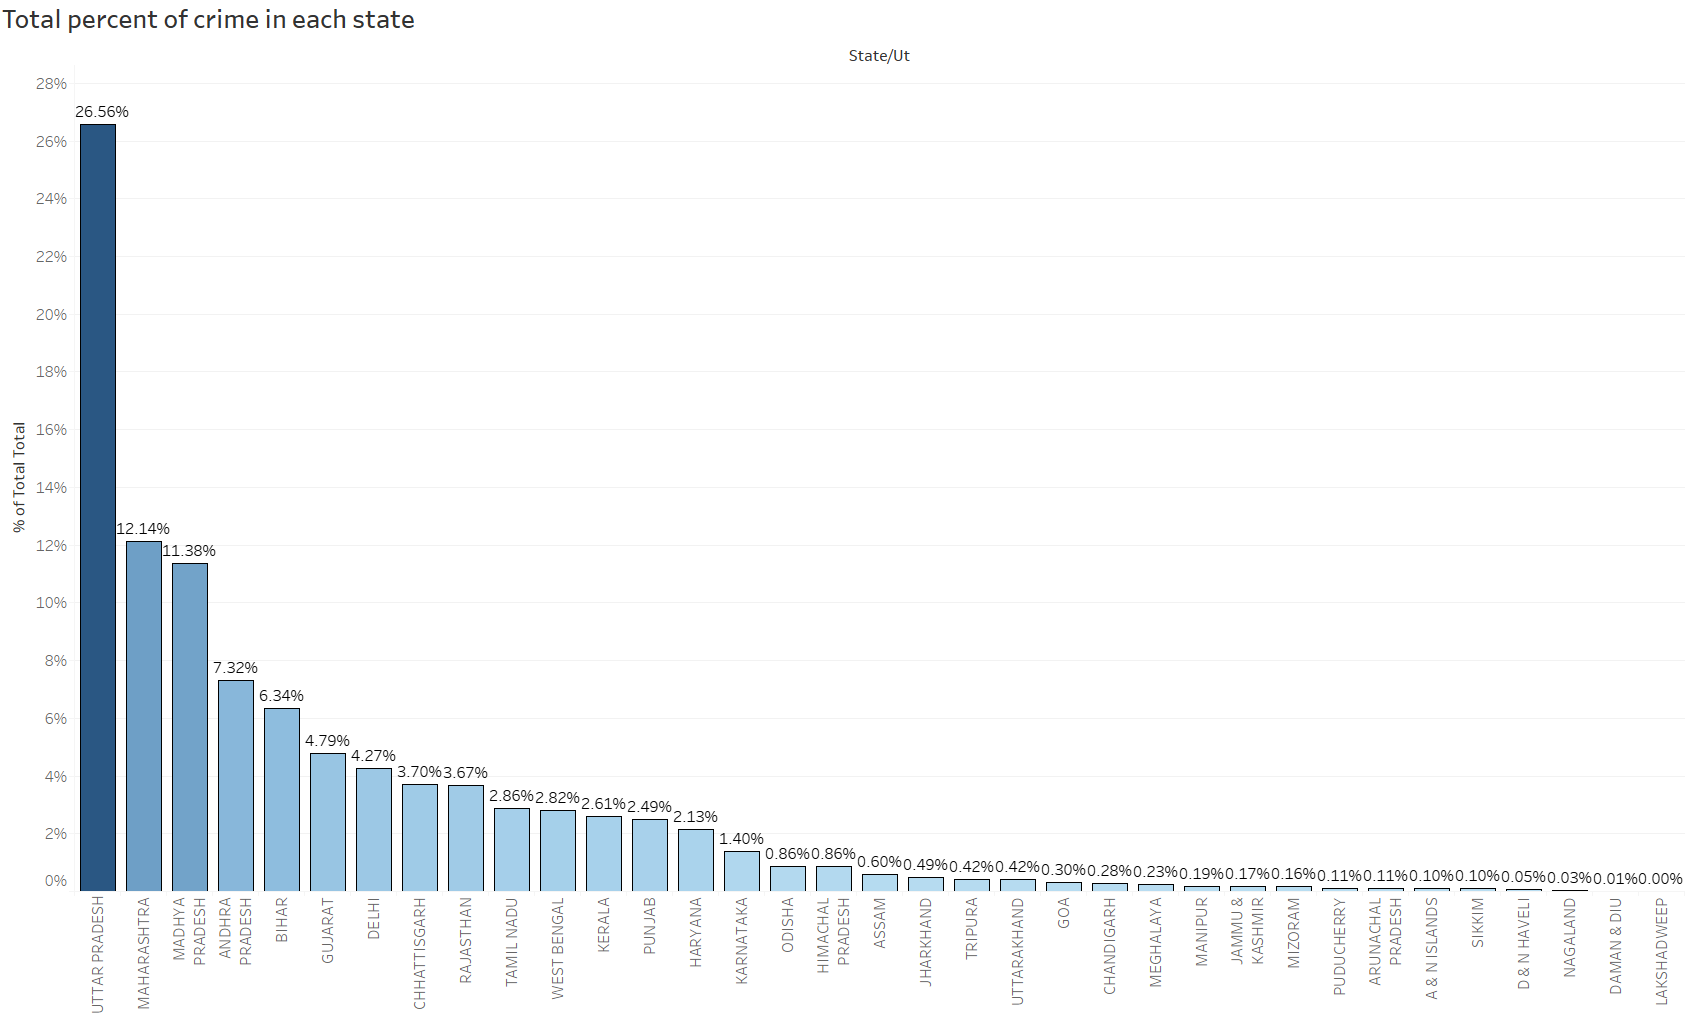
After getting the overall picture of crime enacted against children the graph above gives the total percent of crime occured in each individual state.The graph depicts the descending rate(higher to lower) of crime done on children.Also it is clearly defined by the variation of color shades,where dark shade depicts higher crime rate and lighter shade depicts lower rate of crime.Here its clearly seen that Uttar Pradesh have higher rate of crime done against children and Lakshadweep have the least crime done against children.
3. Total percentage of different crimes in India
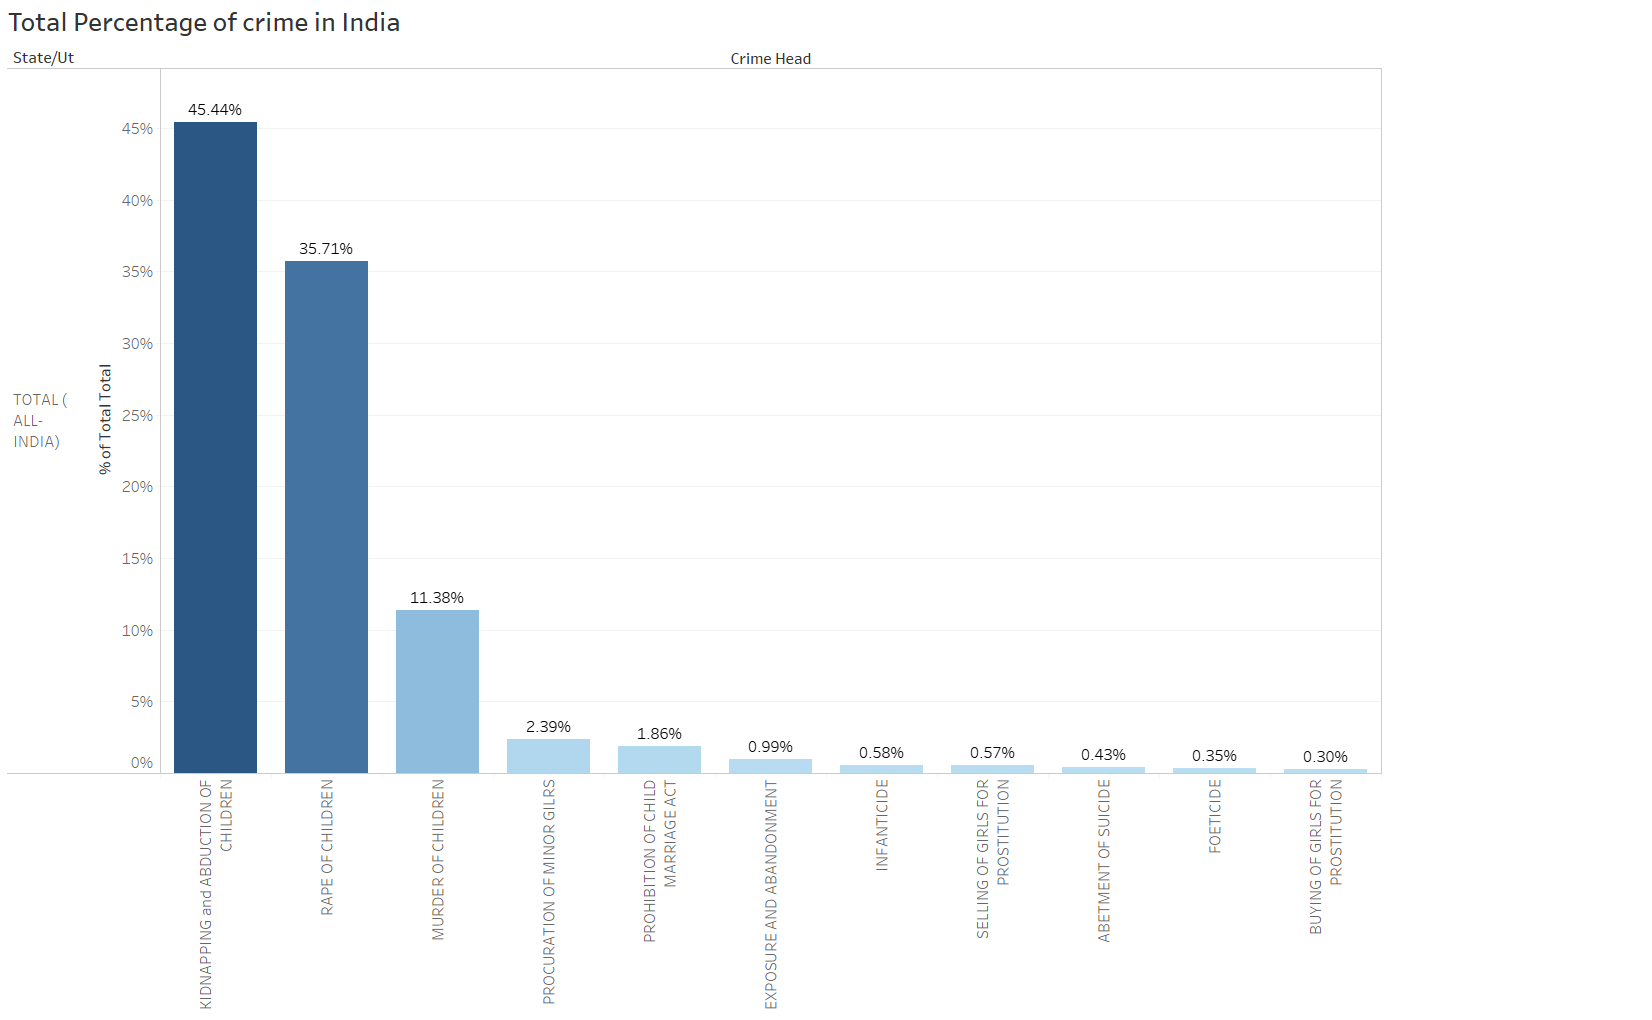
After getting the idea about the crime that were imposed over children in different states let’s get into more deep insight by exploring the different types of crimes that are being done against children. In the above graph clearly depicts the different types of crimes that are imposed against children.Apart from these types there are other types of crime that are done against children but the main categories are those depicted in the graph.It gives the overall percentage of particular crime imposed against children. Here it is clearly picturized that children are being kidnapped at high rate which is one of the great concerns that have to be lower down and possibly eradicate it.

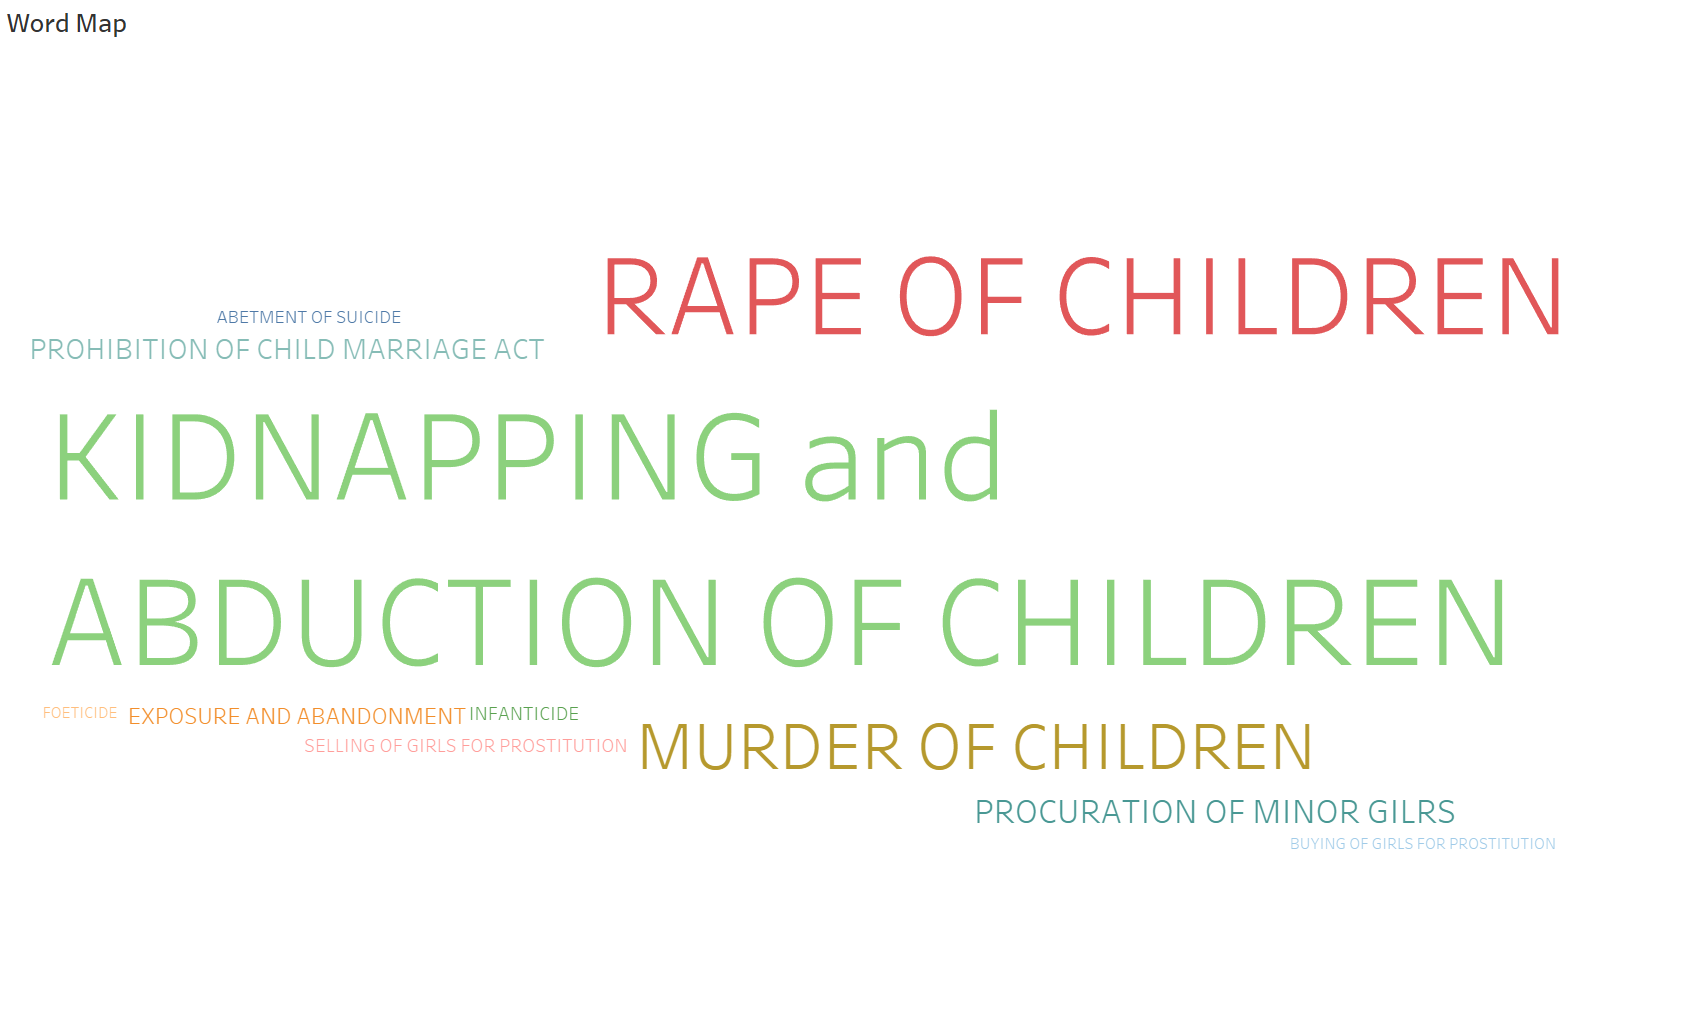
The previous graph depicts the total percentage of different areas in which the crimes are enacted against children. Through word cloud it picturize the overall scenario of main types of crimes done against children by the different font size of the particular type in accordance to its number of occurance.In word map larger the font size of the particular type depicts the higher rate of occurrence and smaller the font size of the particular type tends to lower rate of occurrence.This gives an easy way to visualize the data by just taking a single glance of it.
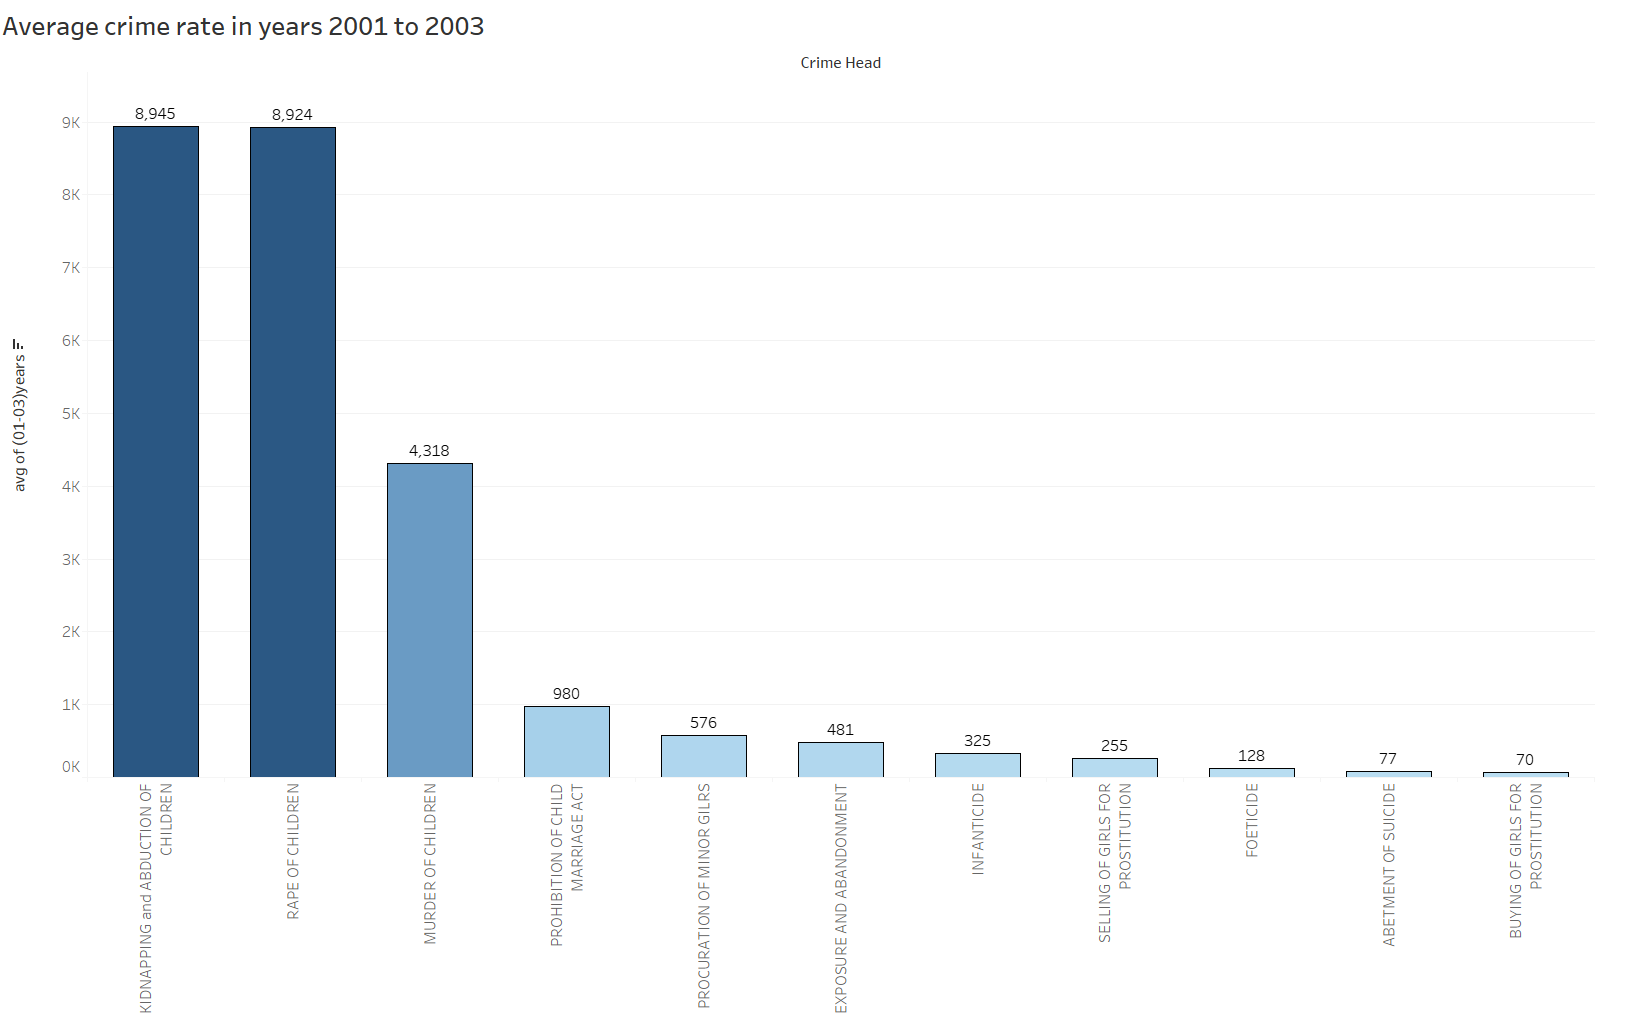
From the previous graphs we got the knowledge about the different sections of crimes done against children in the years from 2001 to 2012. To get more deeper insight we just divided 12 years into 4 trimisters. The above graph depicts the crimes that happened against children in the years from 2001 to 2003.In these three years the children were kidnapped in high rate which is depicted with drker shade of color.
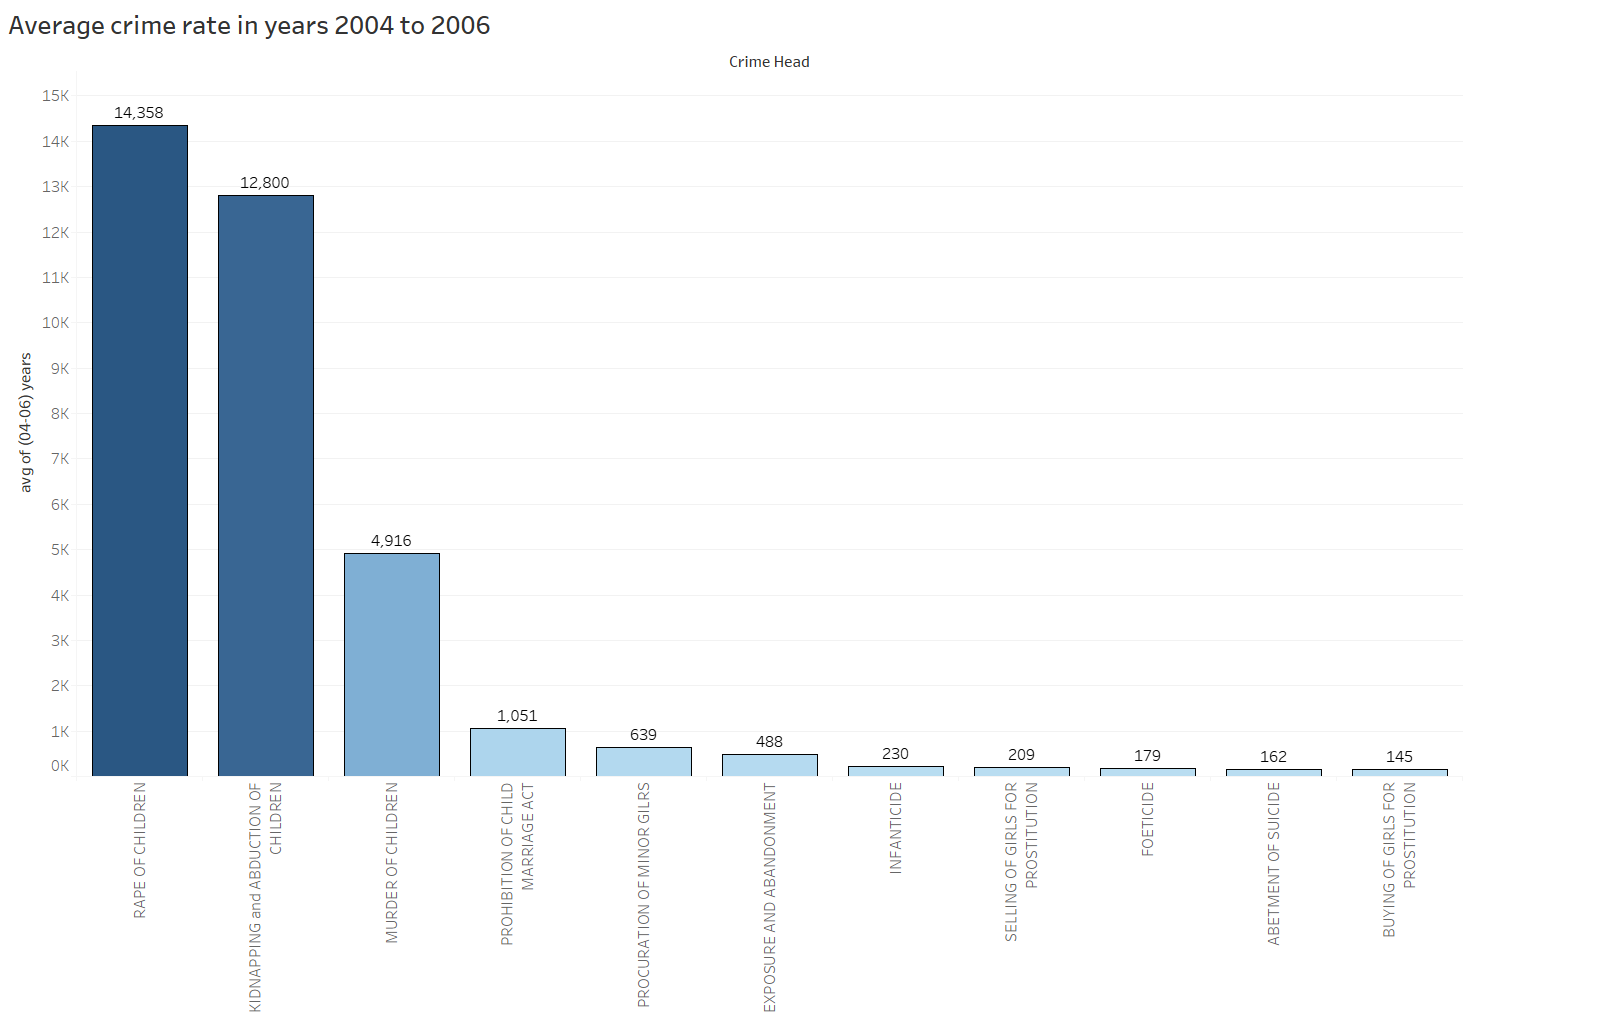
After getting the idea about the crime rate in the first trimester(2001-2003) now let’s get into the insights of second trimester that is from year 2004 to 2006. In this trimister it is being picturized clearly that the crime associated with rape of children has been recorded in higher rate. In this trimister kidnapping is also the second most recorded crime but the crime rate has been increased from the first trimister.The increase in crime rate of particular crime gives the clear idea that the effective measures should be applied to get over the increasing rate.
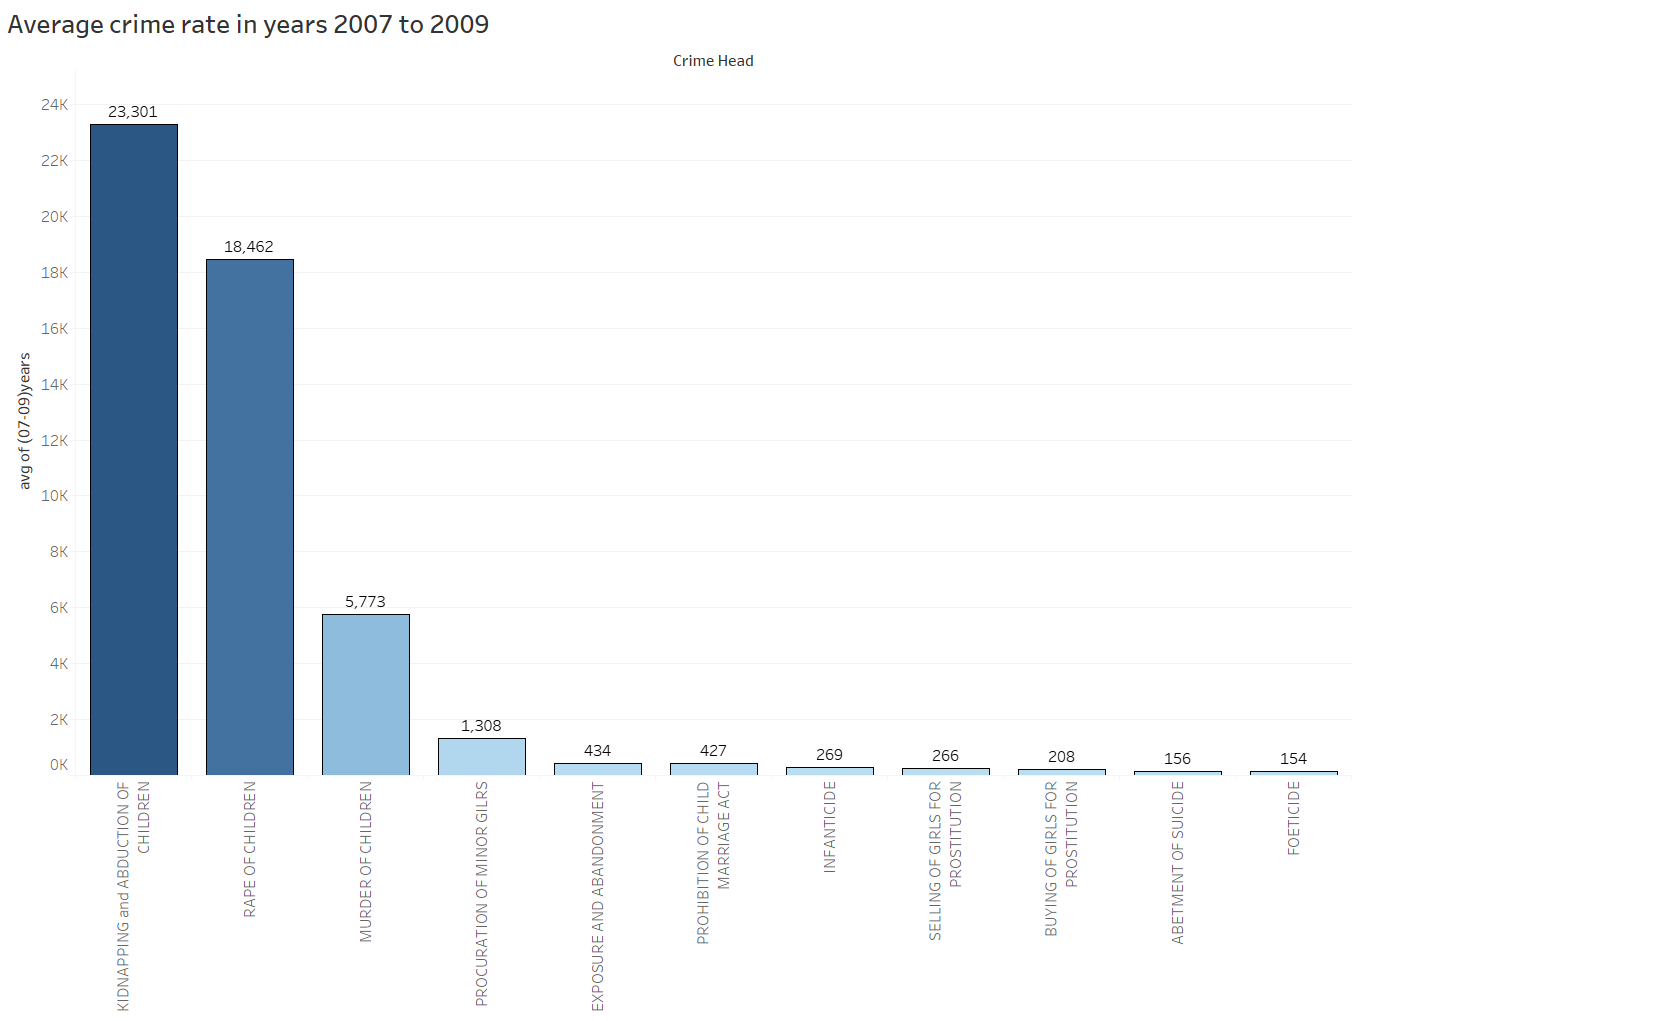
After getting the deep insights about the first two trimesters about the crime imposed against children.Now let’s move forward and get the insights of the third trimester that is from year 2007 to 2009. Through the above graph we get the clear idea that the crime rate of kidnapping of children is again recorded the highest crime enacted in this trimester.Apart from kidnapping the rate of all the crime sections are increasing as the years are increasing, which is one of the main areas of concern where steps should be taken to decrease the rate or eradicate completely.
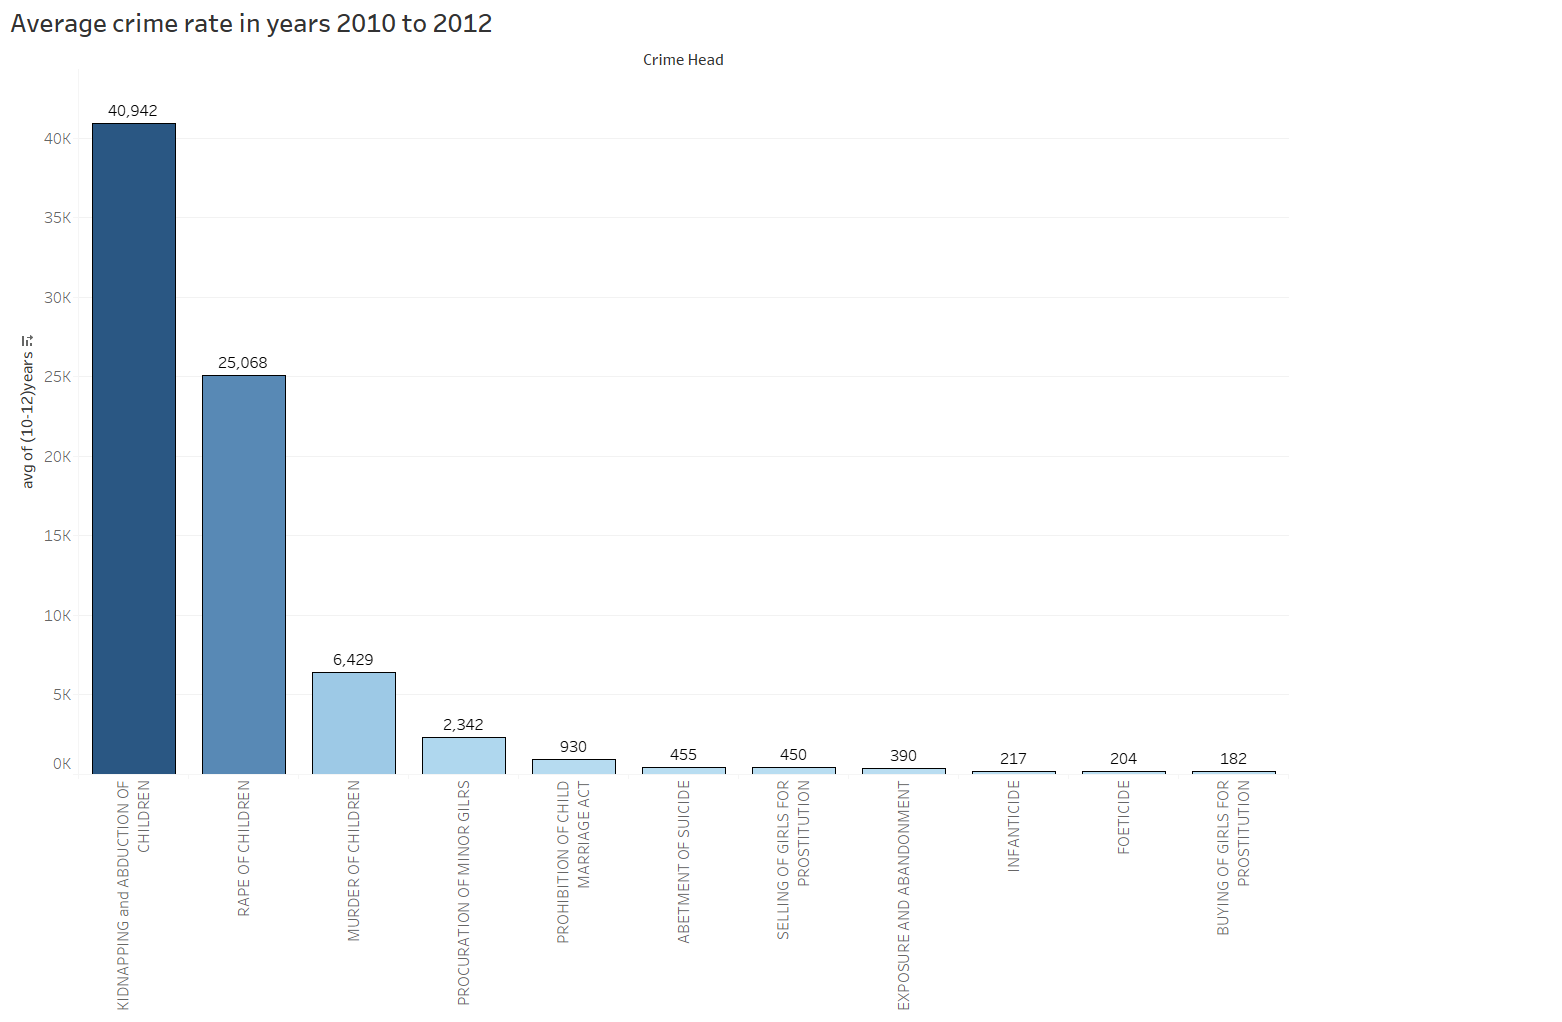
The fourth trimester that is from year 2009 to 2012 gives the knowledge that kidnapping of children has the higher crime rate and rape of children is the second most crime enacted in this trimester. But also the other crime heads are also increasing year by year. Again it gives a clear idea that the crime rate of each crime head is increasing in every trimester. This increasing rate should be taken under the deep knowledge to decreasing them and eventually eradicate it.
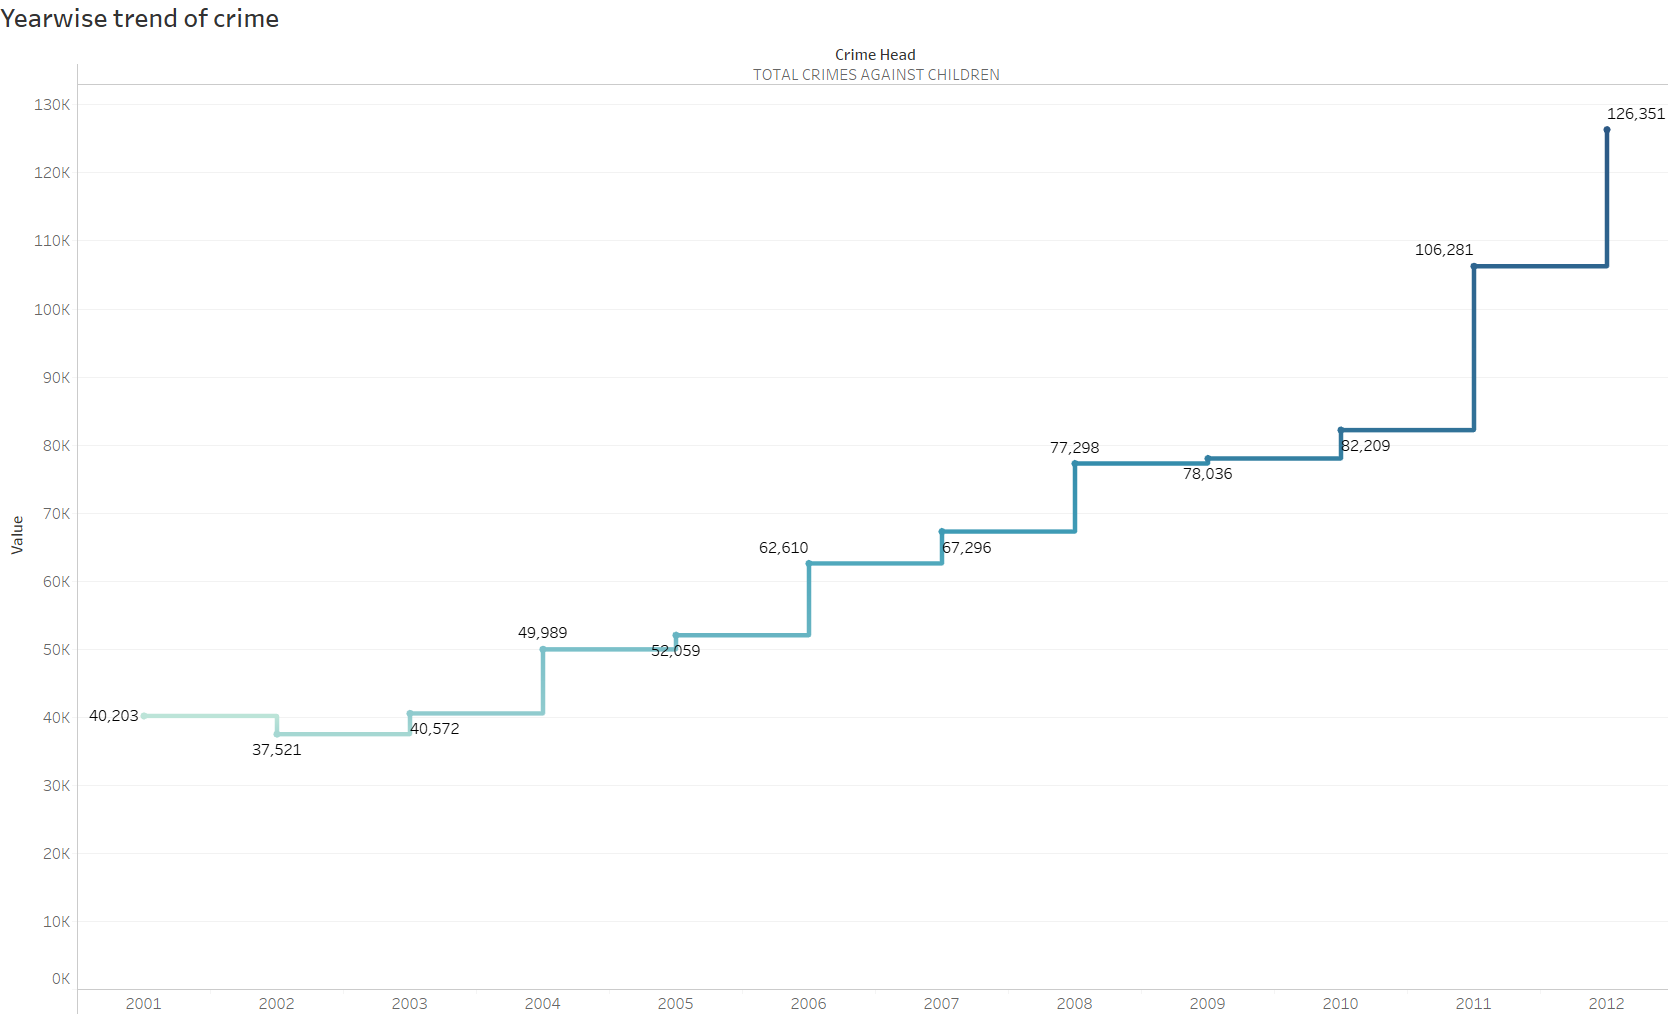
After getting the insights of each trimester individually about the crime rate of all individual crime head or crime sections, the above graph describes the 12 years trend about the crime rate that is from year 2001 to 2012. The graph here depicts the overall trend of crime rate imposed against children.The above graph gives a clear knowledge that the crime rate is drastically increasing every year. This drastic increase is one of the great areas of concern.
Thank You
Don't miss the text