

Mayur Joshi
Tableau Developer
It is truly said that “ Picture speaks a thousand word then the thousand words speak.” The main motive behind this article is to get an accurate knowledge about the suicides that have been committed in India due to various reasons. With the help of which we can take some measures to overcome this rate and try to save lives of people. Through this article we will be visualizing and getting insights of data in graphical format. This will make it easy to view the data. For this article we have taken real time data of suicide attempted for years from 2000 to 2013. In this article we will view the data from different prospects and get the insights of the data.
Before visualling any data, first data is gathered from different sources. Then the data is cleaned as raw data may contain garbage values. After cleaning data,the data is sorted and stored in a required manner.After going through this steps data is made ready for getting visualized and getting the precise insights. The data visualisation is done by taking different combinations of the measures and dimensions which will give a more precise and concise depiction of the data. It is shown on the different worksheets.
The different worksheets depicted through this data are:
So, now let’s get the detailed study of each worksheet individually.
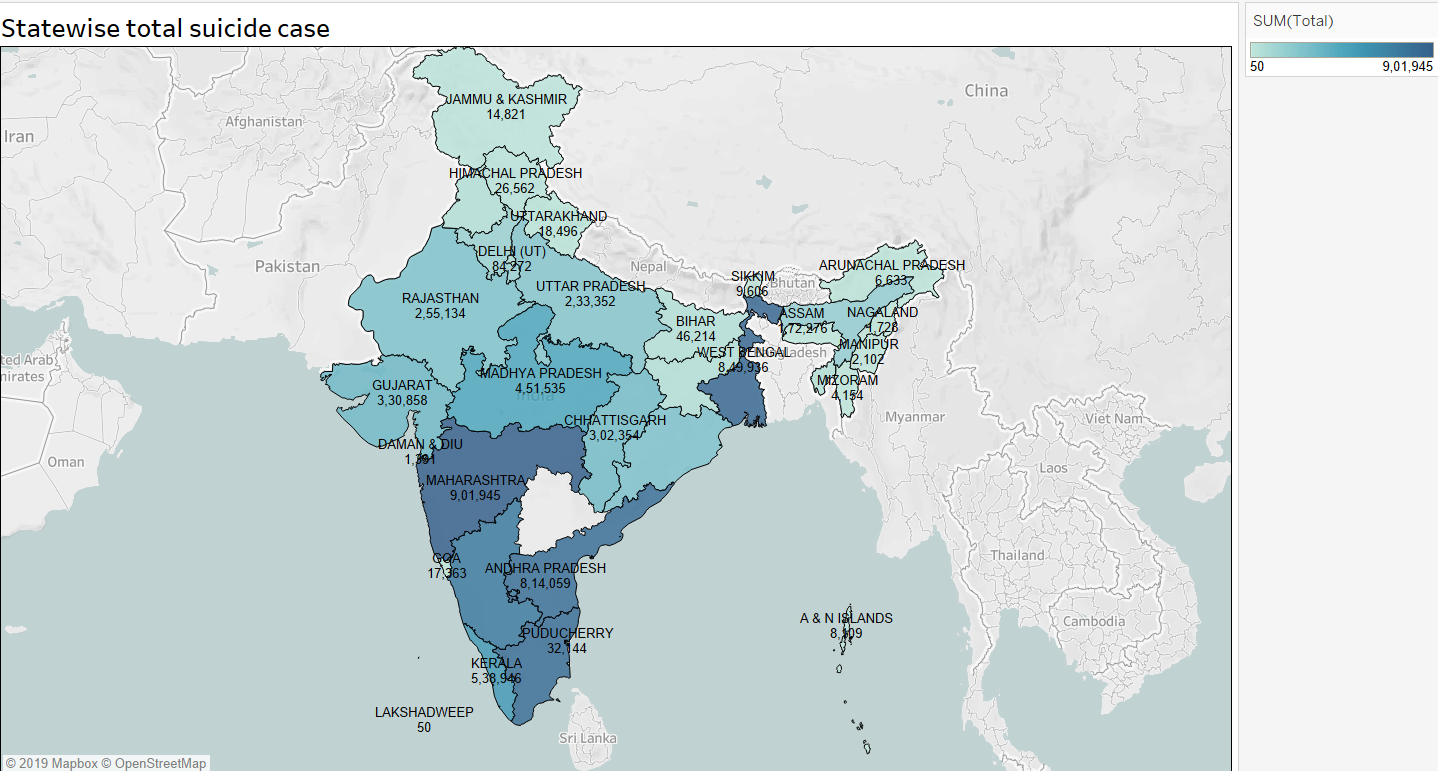
This graph depicts the overall summary of suicide attempted in each state. The variation of colours represents the maximum to minimum attempts of suicide in each state,where dark color symbolises higher number of attempts and lighter the colour lower the number of suicide attempts. A clear picture can be seen through graph that maximum suicides are attempted in Maharashtra whereas the least suicides are attempted in Nagaland.
Now let's get into some more detail insights of suicide attempts.
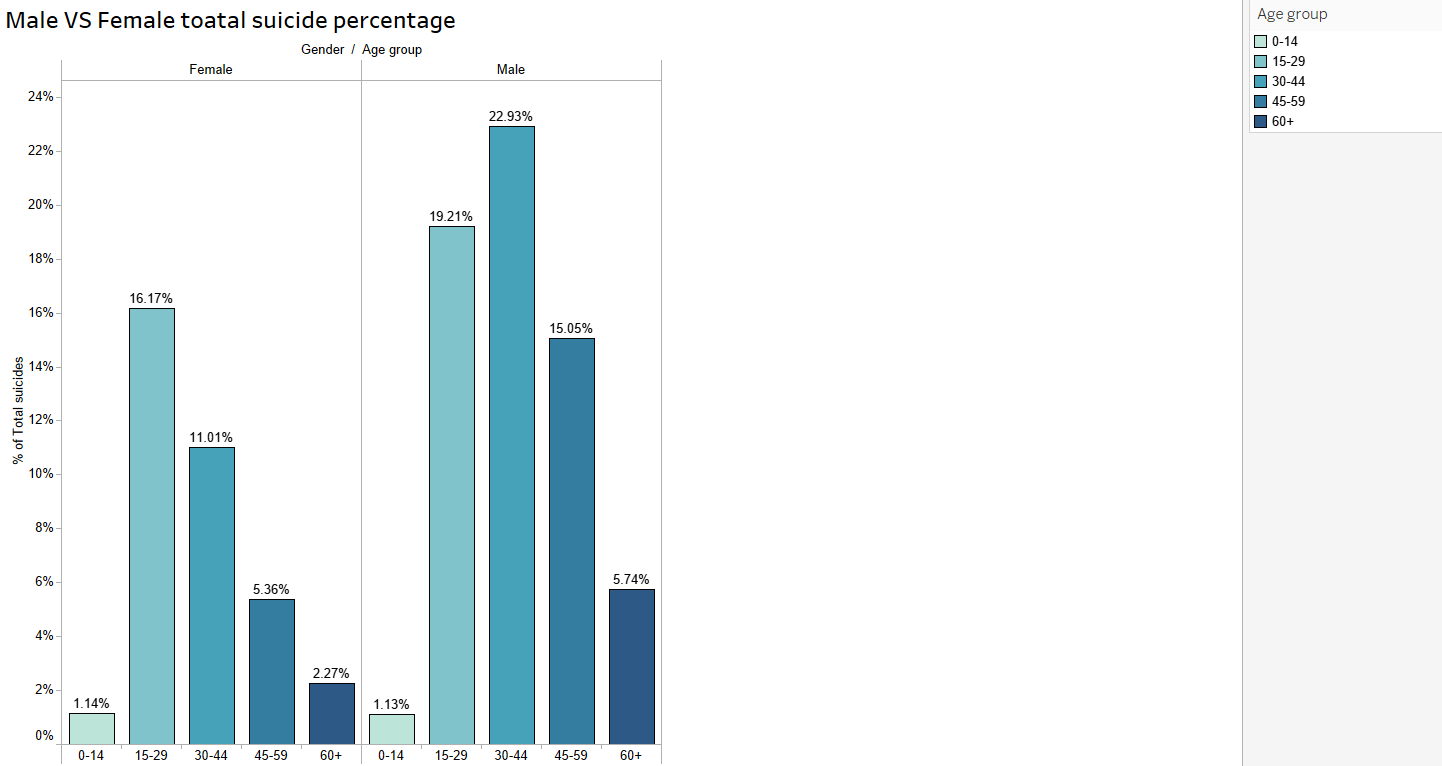
In the previous graph we saw the integrated summary of each state. Here , the plot depicts more deeper insights by differentiating the suicide attempts on the basis of male and female individually. To get a precise idea, gender has been divided into different age groups. This gives more detail picture of data.
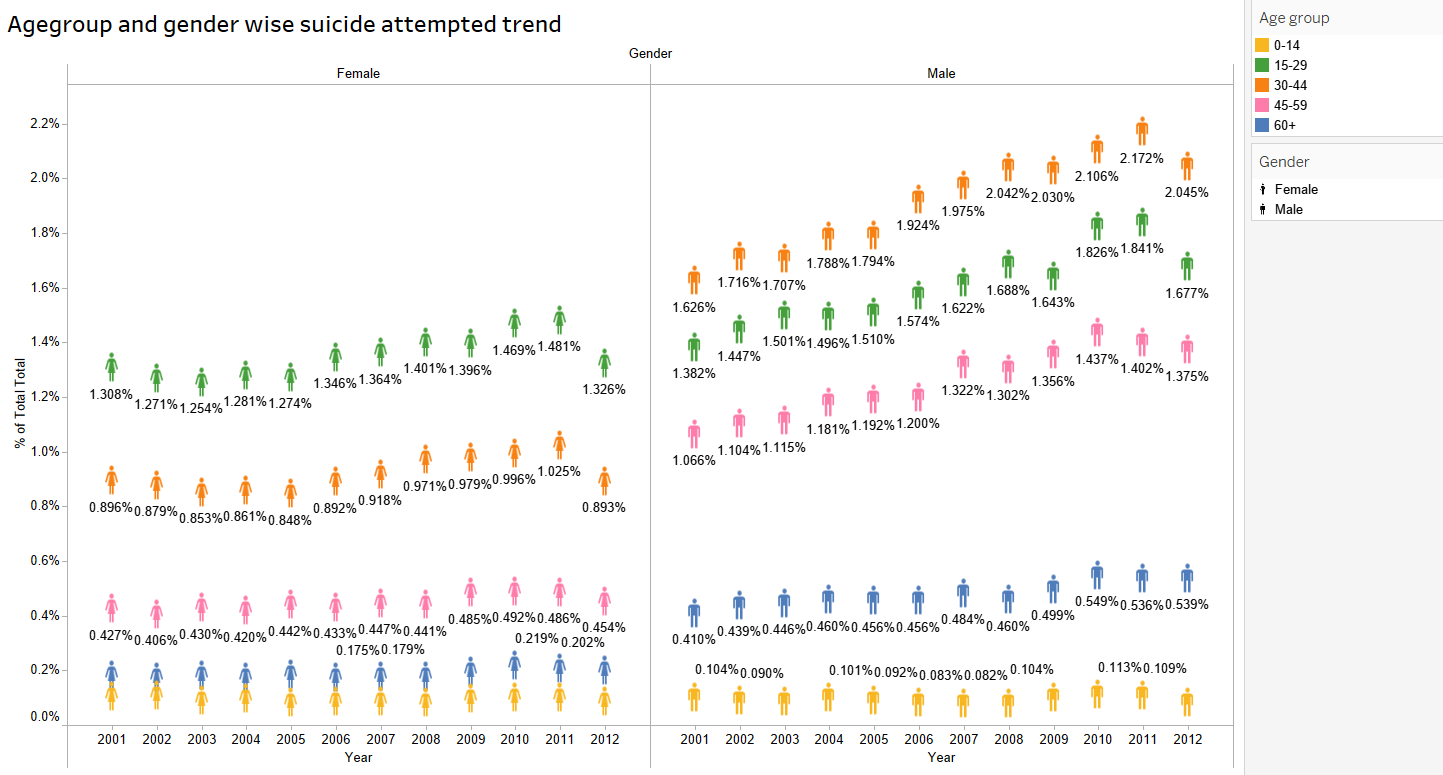
The graph with only gender and age group differentiation had a overall view of the suicide attempted. For more deep insight let’s look at this plot which gives an yearwise trend of the gender with the variation of each age group. In this plot different colours depicts the different age group. The trend helps in visualizing the insights more precisely.

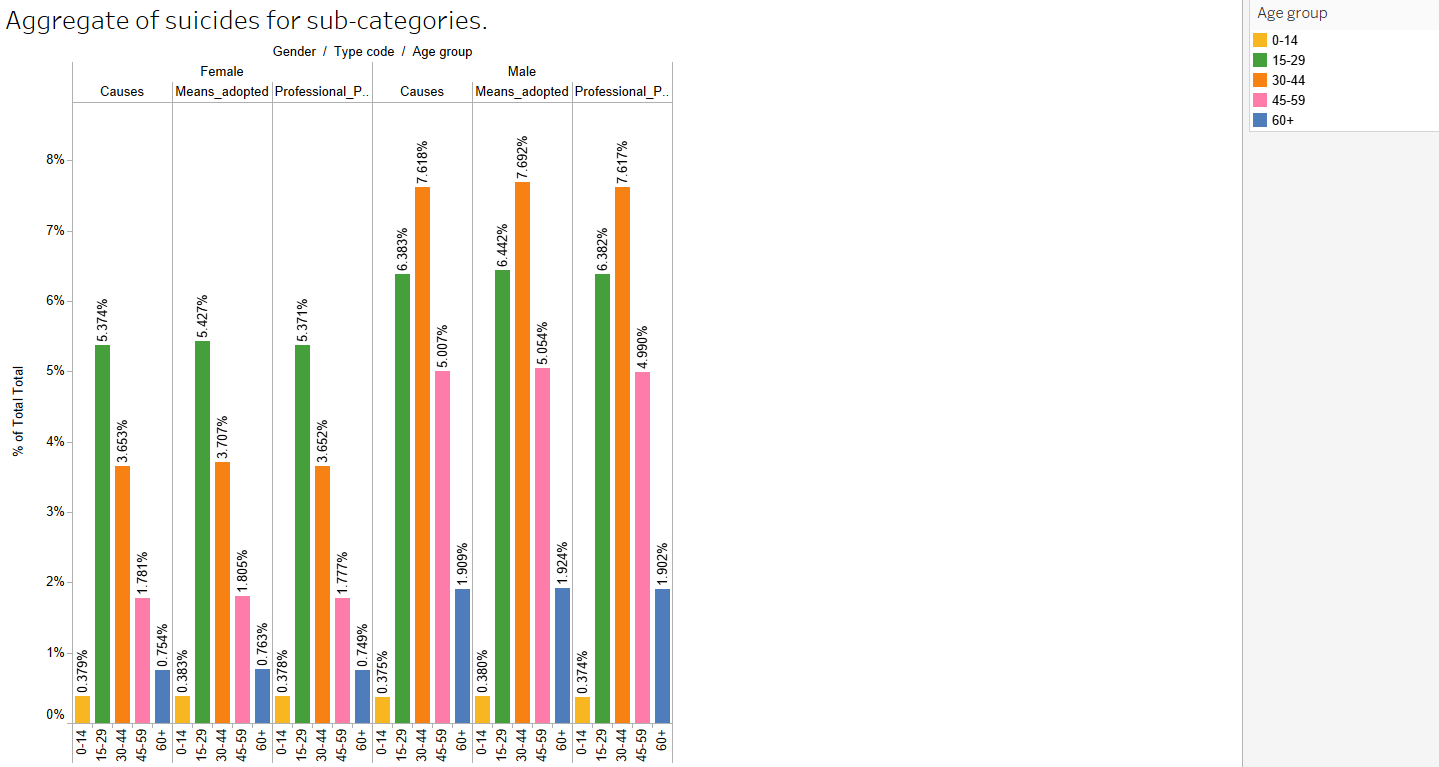
From the previous graphs we depicted the insights from different angles emphasizing on the gender and age groups. Now let’s get the insight from the angle of causes of suicide attempted. The above graph depict the main causes of suicide attempted. The graph gives more precise information as it depicts the graph with different age groups of male and female individually.
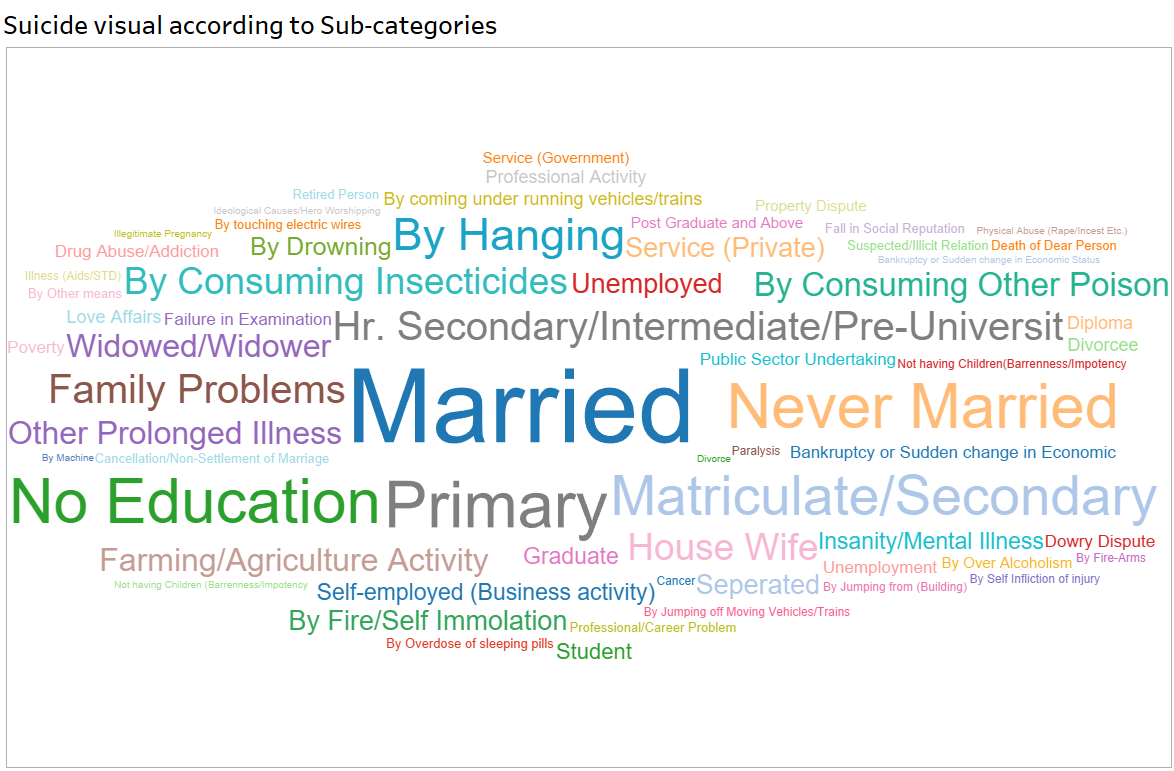
The previous graph depicts the main causes of attempting suicide. Now lets picturize the overall causes of attempting suicides which basically lie under the main causes. The word cloud here depict the subcategories that belongs to respective main causes of attempting suicides. In word cloud larger the font size of the word signifies higher the frequency of that category of attempting suicides and smaller the font size of the word signifies lower the frequency of attempted suicides under that particular category.

After getting the overall picture of the causes let's get more precise view , for that the above graph depicts the different causes of suicides. It depicts the precise picture of different causes of attempting suicides. In this a filter has been applied on categories so that we can view the categories under main causes.
At the end, after taking insights and then analysing them in almost every possible scenario for getting a precise knowledge about the suicides that is being committed all over India. It is clearly picturized that the suicide rate is increasing radically every year in every specific reason of committing suicides. Hence, through this analysis it gives us a clear cut picture that it is a great area of concern and as a responsible citizen of our Nation, it is our duty to get into the roots of the problem and motivate people not to take the wrong step and conquer the problem.
Don't miss the text